


Dylibso provides observability SDKs for WebAssembly (Wasm), enabling continuous
monitoring of WebAssembly code as it executes within a runtime. It provides
developers with the tools necessary to capture and emit telemetry data from Wasm
code, including function execution and memory allocation traces, logs, and
metrics.
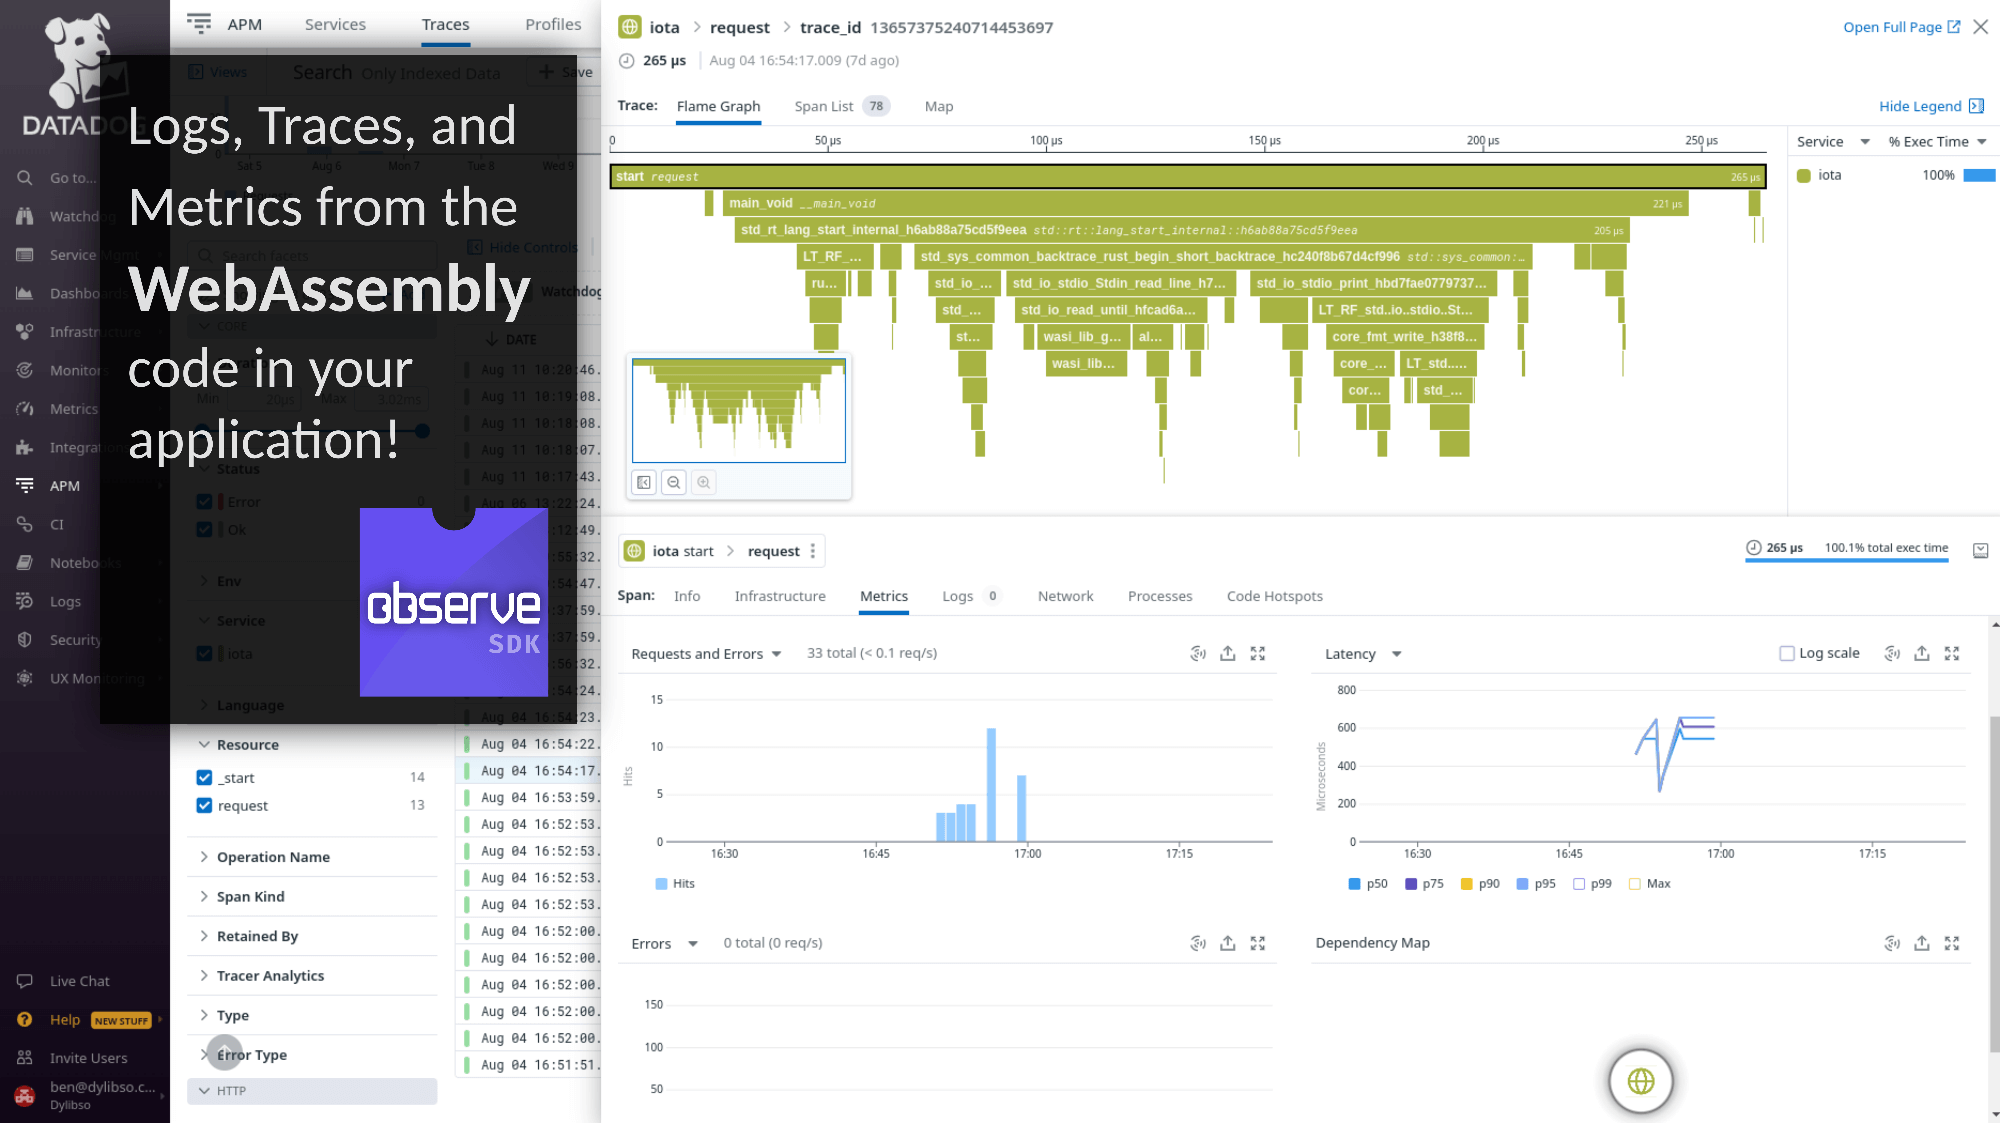
Emit WebAssembly telemetry to many supported platforms

Whether you use a managed platform such as Datadog, or a self-hosted solution
like Zipkin, Observe SDK Adapters make it easy to send Wasm telemetry wherever
it needs to go.
See the officially supported platforms by choosing
which language library you would use.
Open Source
This GitHub repository contains the
Runtime SDKs and the Adapters necessary to have live profiling & tracing, logs,
and metrics. Please read the following overview as it touches on the various
components necessary to monitor your Wasm code.
Why a new stack for WebAssembly?
There are many technical and legacy reasons why existing observability stacks
(agents, tracers, collectors, etc) don’t work in Wasm. For a high-level
understanding, we recommend reading through this blog post,
“Observability Challenges in Wasm”.
To go deeper, watch this talk by
our co-founder, Ben Eckel, about these same challenges in further detail.
Usage
There are two distinct steps when using the Observe SDK:
1. Adding an Adapter To Your Application
In order to extract telemetry data from Wasm, you must add an
Adapter to the application where you execute Wasm.
Choose the Adapter for the platform you use to collect & analyze telemetry data.
Adapters are code libraries, so first check if we support the programming
language you use:
Within these language sections, you will find the platforms we officially
support. Choose a language above and see the options listed. There are examples
and documentation about how to use each of these libraries.
Looking for a different adapter?
We provide official adapters for many popular open source & commercial
observability sinks / platforms. If yours is not supported, you can create an
adapter fairly easily or make a request to our team. Please open an issue on the
GitHub respository, or email us at
support@dylibso.com.
2. Instrumenting your code (automatic or manual)
In order for any telemetry data to be extracted, the code you want to monitor
needs to send some signals about what it’s doing. This is where
instrumentation comes in to play. We offer two ways to instrument your code:
Automatic Instrumentation
Using our automatic instrumentation tools, you can take a compiled Wasm module
(.wasm binary) and have it fully instrumented for function and memory
allocation tracing. This will provide a detailed trace of all activity in your
code. We recommend this for debugging your own code, as well as tracing Wasm
modules that you didn’t compile (and thus don’t have the source code).
Automatic instrumentation focuses on tracing only, but this could be expanded
in the future.
NOTE: support for the Component Model is coming soon. Please reach out to us
if this is something you need
(support@dylibso.com).
👉 Learn more about automatic instrumentation
Manual Instrumentation
The Observe API provides another approach to instrumenting your code, by using
our libraries directly in your source code before it’s compiled to Wasm.
Currently, manual instrumentation using the Observe APIs is the only way to get
logs and metrics in addition to traces from Wasm.
NOTE: you can use both automatic and manual instrumentation in the same code.
👉 Learn more about manual instrumentation
Support
If you’re looking for additional help or would like hands-on support, we’re
happy to be of service. We also are able to provide you with your own offline or
self-hosted version of our automatic instrumentation tools so you can run
everything in your own network.
Please reach out to support@dylibso.com for more
information.
Additionally, visit the
GitHub Discussion page for
general Q&A about the Observe SDK and related products.


